In this article i will show you how to Bind Data in Pie chart Control in WPF.
Step 1
First we need to download WPF Toolkit from the following link.
http://wpf.codeplex.com/
Install WPF toolkit on your System.
Step 2
Download Northwind database from the following link.
http://www.microsoft.com/downloads/details.aspx?FamilyID=06616212-0356-46a0-8da2-eebc53a68034&displaylang=en
Step 3
Attach a Northwind database into MS-SQL server.
Step 4
Create a WPF Application and give the solution name as WpfPieChart.
Step 5
Adding WPF Toolkit Reference.
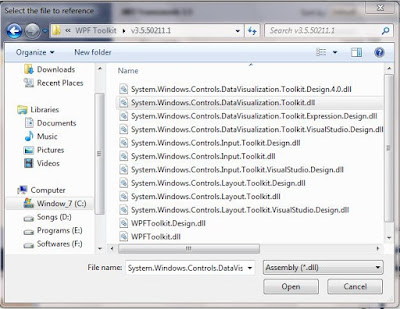
To add a reference, right click the References folder of your project in Solution Explorer and select Add Reference.On this dialog, select Browse option and browse the System.Windows.Controls.DataVisualization.Toolkit.dll assembly from the folder where you installed the WPF Toolkit.
DataVisualization.Toolkit.dll Path
C:\Program Files\WPF Toolkit\v3.5.50211.1\System.Windows.Controls.DataVisualization.Toolkit.dll
Click on Image for Better View
Click on Image for Better View
Step 6
Create a Stored Procedure that we fetch count the number of countries in customer table so we can bind these data into Pie Chart Control,it is look like this
Step 7
Create a Customers static class in the solution for retrieving number of countries from customer table,it is look like this
Step 7
Now Add DataVisualization assemble reference to the page on window tag, it is look like this
Finally it's look like this
Step 8
Now Creates a Pie Chart and Bind customers data in Pie Chart,it's look like this
The dependent value is the value displayed on the chart. The independent value is the label shown in the legend.
Step 9
Now Bind the data in Pie Chart Control in Code Behind,it is look like this
Run the Project.
Output
Click on Image for Better View
Full XAML Code
Download
Download Source Code
Step 1
First we need to download WPF Toolkit from the following link.
http://wpf.codeplex.com/
Install WPF toolkit on your System.
Step 2
Download Northwind database from the following link.
http://www.microsoft.com/downloads/details.aspx?FamilyID=06616212-0356-46a0-8da2-eebc53a68034&displaylang=en
Step 3
Attach a Northwind database into MS-SQL server.
Step 4
Create a WPF Application and give the solution name as WpfPieChart.
Step 5
Adding WPF Toolkit Reference.
To add a reference, right click the References folder of your project in Solution Explorer and select Add Reference.On this dialog, select Browse option and browse the System.Windows.Controls.DataVisualization.Toolkit.dll assembly from the folder where you installed the WPF Toolkit.
DataVisualization.Toolkit.dll Path
C:\Program Files\WPF Toolkit\v3.5.50211.1\System.Windows.Controls.DataVisualization.Toolkit.dll
Click on Image for Better View
Click on Image for Better View
Step 6
Create a Stored Procedure that we fetch count the number of countries in customer table so we can bind these data into Pie Chart Control,it is look like this
CREATE PROCEDURE SpCountCountry
AS
	SELECT Customers.Country,COUNT(Customers.Country) as 'Count' FROM Customers
GROUP BY Customers.Country
ORDER BY Customers.Country ASC

GO
Step 7
Create a Customers static class in the solution for retrieving number of countries from customer table,it is look like this
using System;
using System.Collections.Generic;
using System.Linq;
using System.Text;
using System.Data;
using System.Data.SqlClient;
namespace WpfPieChart
{
public static class Customers
{
///
/// Count Country in Customers Table
///
///
Step 7
Now Add DataVisualization assemble reference to the page on window tag, it is look like this
xmlns:ChartTools="clr-namespace:System.Windows.Controls.DataVisualization.Charting;assembly=System.Windows.Controls.DataVisualization.Toolkit"
Finally it's look like this
<Window
        xmlns="http://schemas.microsoft.com/winfx/2006/xaml/presentation"
        xmlns:x="http://schemas.microsoft.com/winfx/2006/xaml"
        xmlns:ChartTools="clr-namespace:System.Windows.Controls.DataVisualization.Charting;assembly=System.Windows.Controls.DataVisualization.Toolkit"
        x:Class="WpfPieChart.MainWindow"
        Title="Pie Chart" Height="350" Width="525">

</Window>
Step 8
Now Creates a Pie Chart and Bind customers data in Pie Chart,it's look like this
<Grid>
		<ChartTools:Chart x:Name="PieCustomerChart" Title="Customers Countrywide">

			<ChartTools:PieSeries ItemsSource="{Binding}"
				IndependentValueBinding="{Binding Country}"
				DependentValueBinding="{Binding Count}" Title="{Binding Country}">
				</ChartTools:PieSeries>

		</ChartTools:Chart>
	</Grid>
The dependent value is the value displayed on the chart. The independent value is the label shown in the legend.
Step 9
Now Bind the data in Pie Chart Control in Code Behind,it is look like this
using System;
using System.Collections.Generic;
using System.Linq;
using System.Text;
using System.Windows;
using System.Windows.Controls;
using System.Windows.Data;
using System.Windows.Documents;
using System.Windows.Input;
using System.Windows.Media;
using System.Windows.Media.Imaging;
using System.Windows.Navigation;
using System.Windows.Shapes;

namespace WpfPieChart
{
    ///
    /// Interaction logic for MainWindow.xaml
    ///
    public partial class MainWindow : Window
    {
        public MainWindow()
        {
            InitializeComponent();

            BindPieChart();  // Call BindChart Function in Constructors
        }

        #region Methods
        ///
        ///  Bind the Pie Chart
        ///
        private void BindPieChart()
        {
            try
            {
                PieCustomerChart.DataContext = Customers.GetCustomersData();
            }
            catch (Exception ex)
            {
                throw new Exception(ex.Message);
            }
        }

        #endregion
    }
}
Run the Project.
Output
Click on Image for Better View
Full XAML Code
<Window
		xmlns="http://schemas.microsoft.com/winfx/2006/xaml/presentation"
		xmlns:x="http://schemas.microsoft.com/winfx/2006/xaml"
		xmlns:ChartTools="clr-namespace:System.Windows.Controls.DataVisualization.Charting;assembly=System.Windows.Controls.DataVisualization.Toolkit"
		x:Class="WpfPieChart.MainWindow"
		Title="Pie Chart" Height="350" Width="525">

	<Grid>
		<ChartTools:Chart x:Name="PieCustomerChart" Title="Customers Countrywide">

			<ChartTools:PieSeries ItemsSource="{Binding}"
				IndependentValueBinding="{Binding Country}"
				DependentValueBinding="{Binding Count}" Title="{Binding Country}">
				</ChartTools:PieSeries>

		</ChartTools:Chart>
	</Grid>
</Window>
Download
Download Source Code


This code is not working properly...,
ReplyDeletePie chart is not showing
How can this possible sir....
ReplyDeleteThis Code is working properly.
I Tested this solution twice.
May be you did not add DataVisualization assemble reference in your solution....That's why Pie chart is not showing in window page....
Hi Kishore , is it possible to achieve this without suing Stored procedure and use select query in the program ?
ReplyDeleteHi,indhira
DeleteYes you can do......
1.Just Modify below code in your program
SqlComm.CommandType = CommandType.Text;
SqlComm.CommandText = "SELECT Customers.Country,COUNT(Customers.Country) as 'Count' FROM Customers
GROUP BY Customers.Country
ORDER BY Customers.Country ASC";
Or you can use LINQ,like this
NorthwindDCDataContext DC = new NorthwindDCDataContext();
//Using Linq
var Query = (from Q in DC.Customers
group Q by Q.Country into GB
let CountryOrderBy = GB.Key
orderby CountryOrderBy ascending
select new
{
Country = GB.Key,
Count = GB.Count()
}).ToList();
// Using Lambda Expression
var Query = DC.Customers.GroupBy(GB => GB.Country).Select(LE => new { Country=LE.Key,Count=LE.Count() }).OrderBy(OB=>OB.Country).ThenBy(TB=>TB.Count).ToList();
But i recommended you use Stored procedures rather than structural Query.it is best practice.
Good Luck
Thank you so much for your reply Kishor.
DeleteI have tried the above , but my Pie is not slicing.
here is the link for my project, could you please check where I am wrong if you have time. It would be very helpful.
here is the link : https://gist.github.com/7c809b8e2ebc620c95fc
Thanks for your effort !
P.S : I would like to add on that I want to display my Ram Usage on my Pie chart, I have two values in my Datatable displaying the Ram Usage - Used and Total. Total is fixed to a value and my Used keeps on updating when it changes.